
How has what I read changed over twelve years?
Since February 2014, I have kept a daily list of the arXiv preprints that I find interesting. Since October 2017, the list has been public on this site as My daily arXiv picks. I recently gathered all of it, 18,169 papers, into one table and looked at what it says. Here are the highlights.
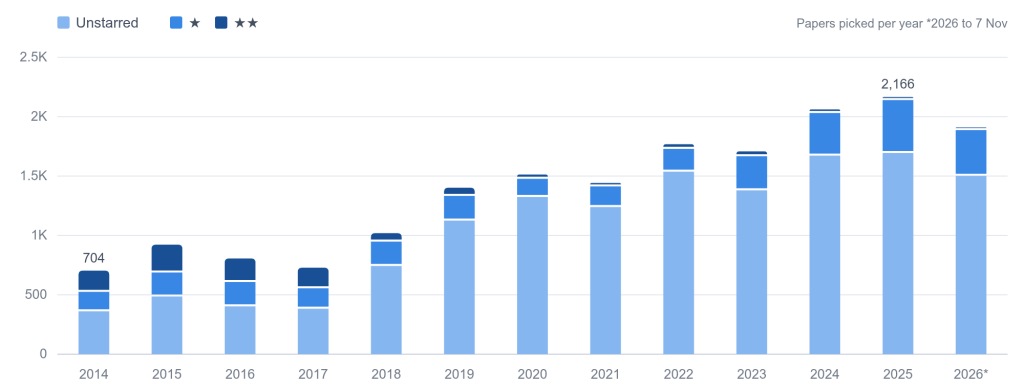
I pick three times as many papers. In 2014 I picked 704 papers. In 2025 I picked 2,166, and 2026 is at 1,910 so far. I have also become much stingier with two stars, which I use for papers that are very relevant to my own work: they made up a quarter of my picks in 2014–2017, and about 2% since 2019.
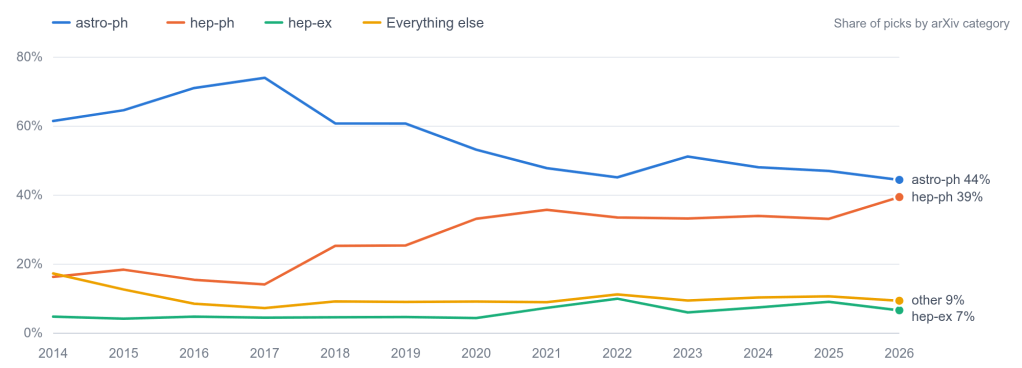
From astro-ph towards hep-ph. In 2014, 62% of my picks were listed in astro-ph and 16% in hep-ph. In 2026, the split is 44% and 39%. Most of the shift happened between 2017 and 2021.
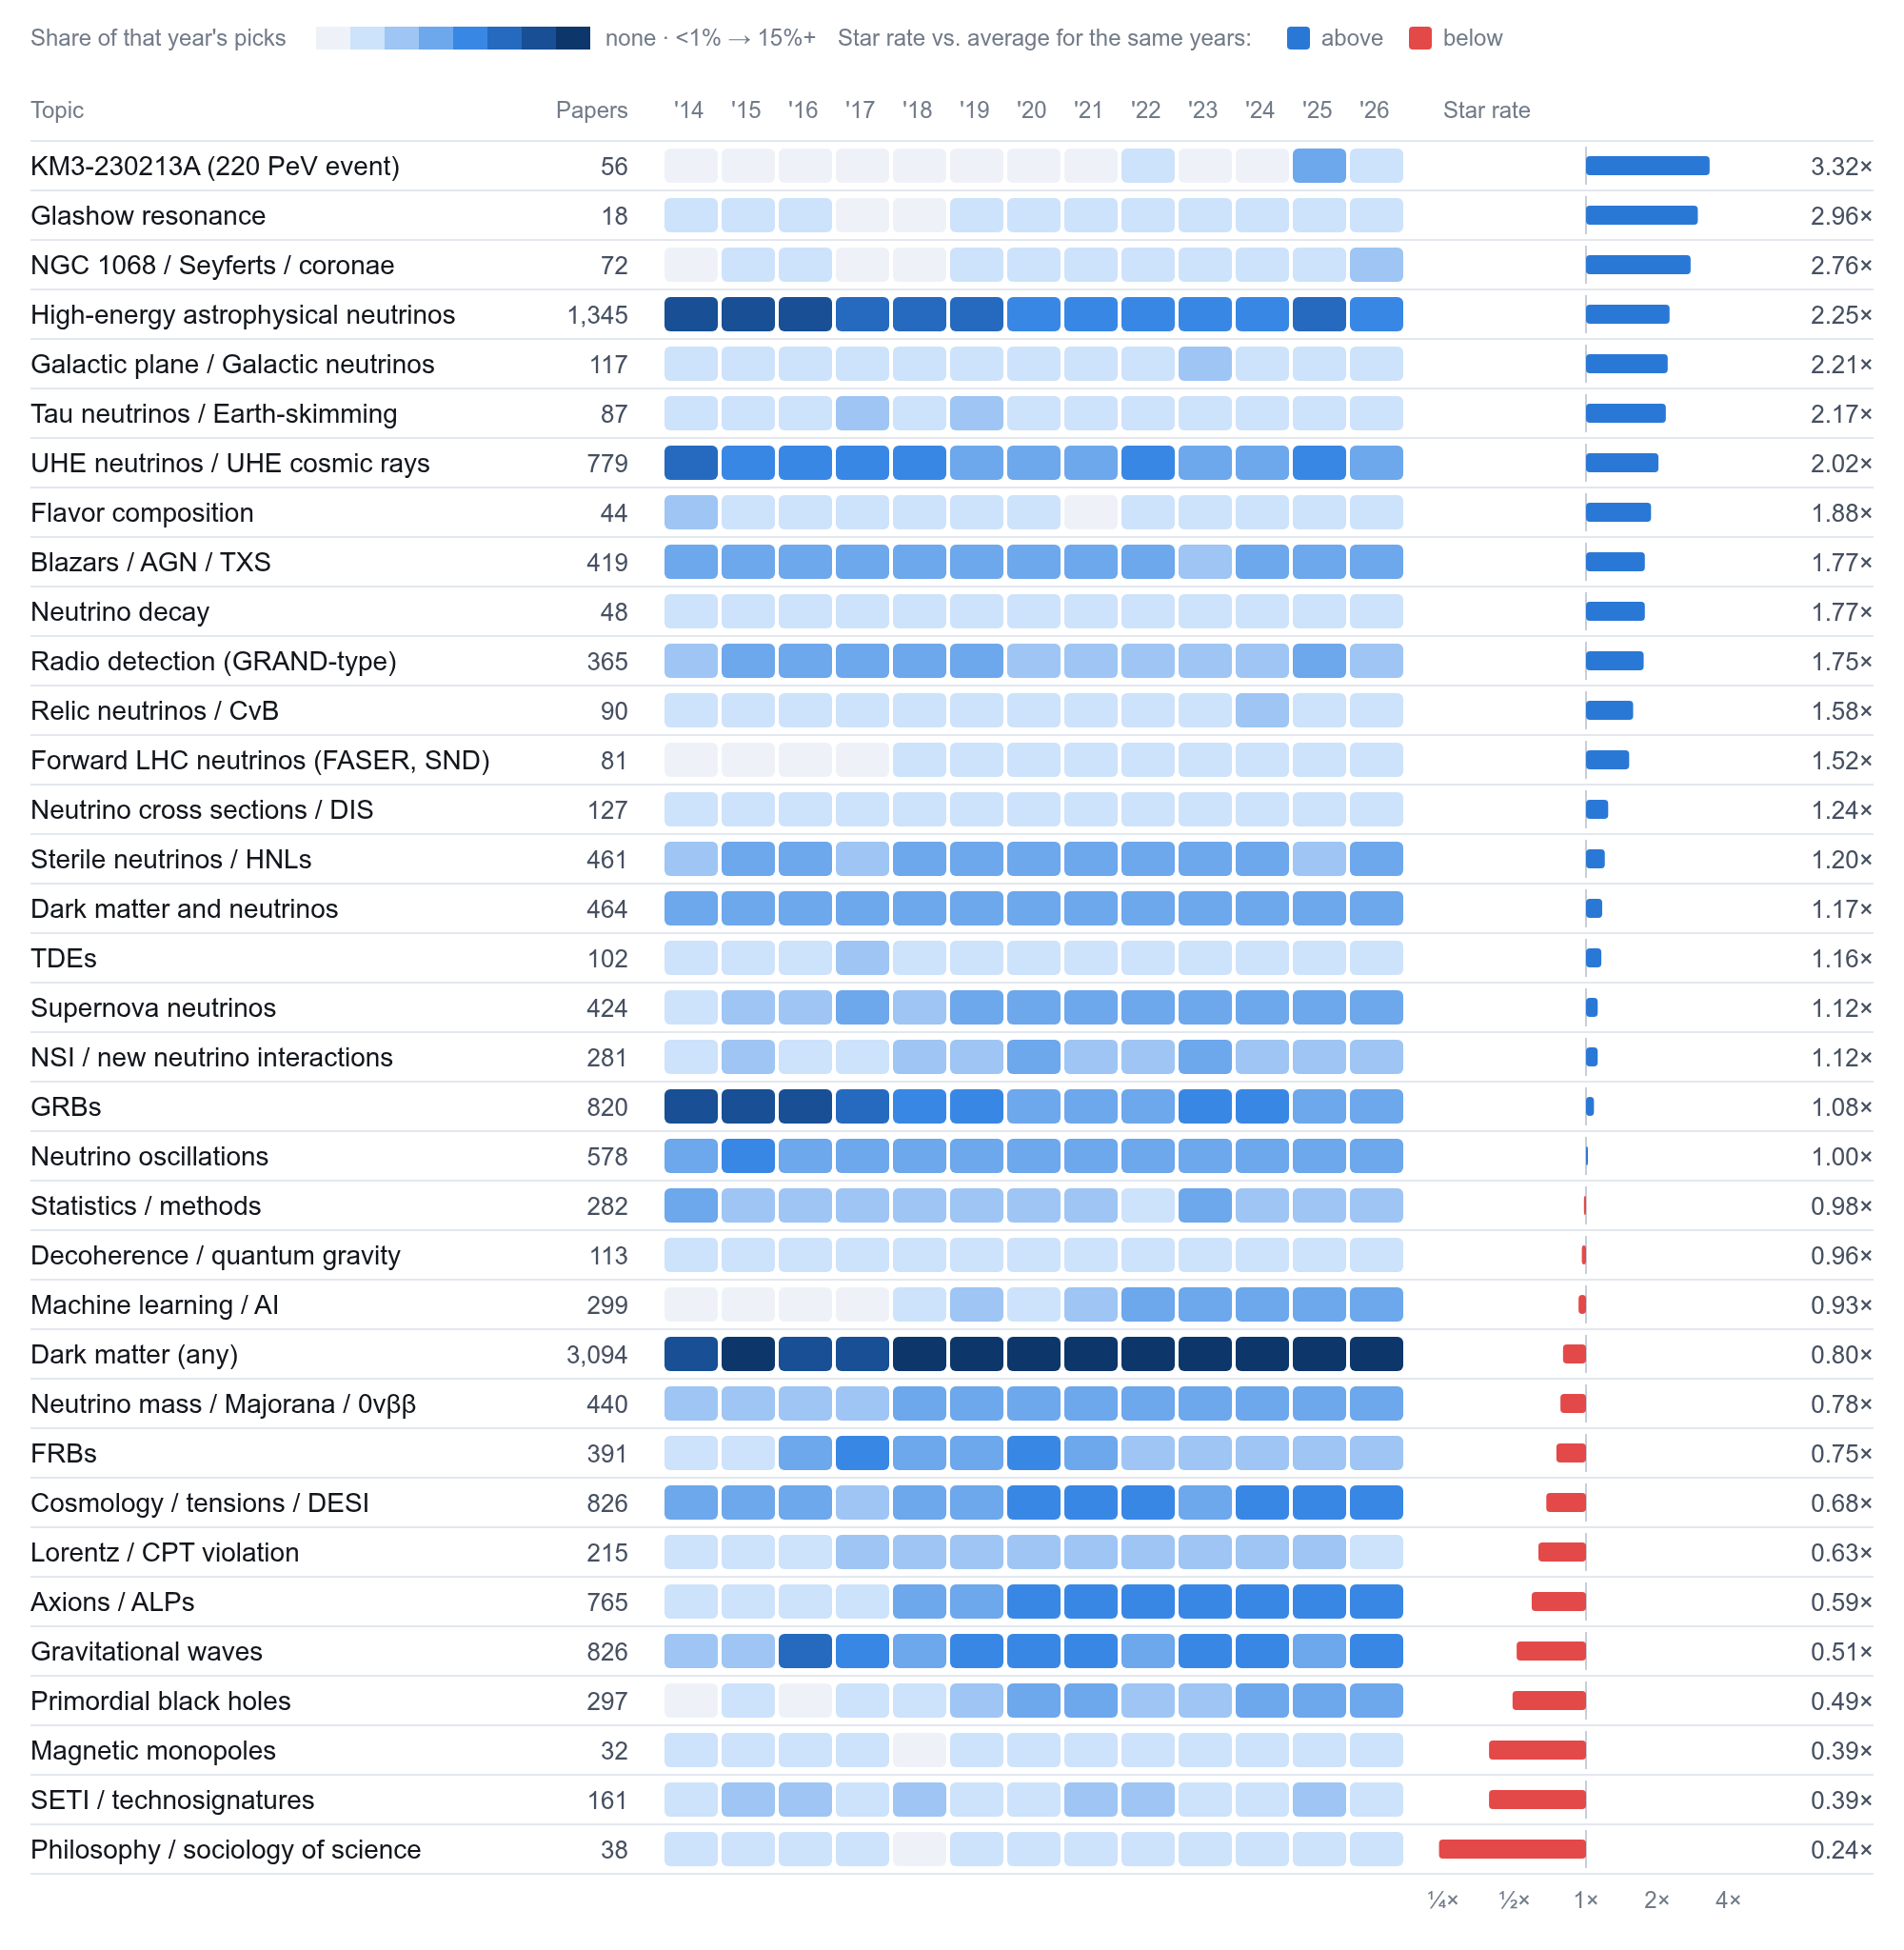
What I read and what I star have drifted apart. To compare topics fairly across years, I compared how often I star papers on a topic with how often I star papers overall in the same years. The topics I star most often are all about high-energy neutrinos: the 220-PeV KM3NeT event KM3-230213A (3.3 times my average star rate), the Glashow resonance (3.0), NGC 1068 and Seyfert galaxies (2.8), and high-energy astrophysical neutrinos in general (2.3).
Dark matter, on the other hand, is the single largest topic I pick: 3,094 papers, about a fifth of my picks in recent years. Yet I star it at only 0.8 times my average rate. Axions grew from under 1% of my picks to about 5%, and machine learning from almost nothing to 4% in 2026, but I rarely star either. Gamma-ray bursts went the other way, from about 11% of my picks in 2014–2017 to 2% in 2025–2026.
Explore the list. I put all 18,169 picks in a searchable page. You can search by title, author, or arXiv identifier, and filter by stars, year, arXiv category, or topic.
A few caveats: topics are assigned by keyword matches on paper titles, so they are approximate, and years come from arXiv identifiers.
I put together the analysis and the searchable page with the help of Claude.

